Sexy Friends Toronto

Carney says new oil pipeline proposal in Canada is highly likely

JohnLarue

Well-known member
Jan 19, 2005
18,821
4,261
113
Do you have any idea how long it takes to build a refinery?

if the over under was 10 years, I would take the over

I do agree, fossil fuels aren’t going anywhere in our lifetime

your grand kids children will still be using fossil fuels
the actual construction tin time to build a refinery is a couple of years

it is the environmental and regulatory bureaucracy which are the bottlenecks preventing new refineries / pipelines

let wing red tape
 

JohnLarue

Well-known member
Jan 19, 2005
18,821
4,261
113

Shad up you
you peddle misinformation as a force of habit

from your propaganda link
The Ember energy consultancy just announced that in June, 2025, solar was the single largest generator of electricity in the European Union.
so who is The Ember energy consultancy ?

Ember (non-profit organisation) - Wikipedia
Ember, formerly Sandbag, is an independent global energy think tank that uses data and policy to accelerate the clean energy transition.[1][2][3][4][5] Headquartered in the UK,[6] the organisation was launched in 2008 by Bryony Worthington.[7][8]

Bryony Katherine Worthington, Baroness Worthington, (born 19 September 1971),[1][2] is a British environmental campaigner

it appears Ember have a credibilty issue
The Mirage of Milestones: Debunking Ember’s 2025 Global Electricity Review – Iowa Climate Science Education


Introduction: Cherry-Picking a “Clean” Story
Ember’s Global Electricity Review 2025 declares a milestone—over 40% of global electricity now comes from “clean” sources. But before hanging up a “Mission Accomplished” banner on fossil fuels, it’s worth asking: what’s missing from this picture? As it turns out, quite a lot.
A deep dive into the report reveals a narrative built on selective framing, unexamined assumptions, and economic blind spots. It tells a story of solar triumph and fossil decline, but only by focusing narrowly on electricity generation—which accounts for just a fifth of global energy use.
This blog post exposes the omissions, distortions, and wishful thinking in Ember’s review, and challenges the illusion that we are on the cusp of a clean energy utopia.

again for all your bluster misinformation and lying the two hard cold undeniable facts remain

1752431437839.png


1752431475691.png


So shut your pie hole
 
  • Like
Reactions: The Oracle

oil&gas

Well-known member
Apr 16, 2002
15,290
2,652
113
Ghawar
If only central Canada could understand we're no longer heating with coal furnaces, using horse & steam for transport, and oil lamps for lighting.

Central Canada understands Eastern Canada will continue buying
oil from the U.S. and the Middle East before proposed new oil pipeline
is in place. I suppose people from all parts of Canada understands
dependence on import of foreign oil is not a good thing.
 

Frankfooter

dangling member
Apr 10, 2015
100,754
27,844
113
Shad up you
you peddle misinformation as a force of habit

from your propaganda link


so who is The Ember energy consultancy ?

Ember (non-profit organisation) - Wikipedia
Ember, formerly Sandbag, is an independent global energy think tank that uses data and policy to accelerate the clean energy transition.[1][2][3][4][5] Headquartered in the UK,[6] the organisation was launched in 2008 by Bryony Worthington.[7][8]

Bryony Katherine Worthington, Baroness Worthington, (born 19 September 1971),[1][2] is a British environmental campaigner

it appears Ember have a credibilty issue
The Mirage of Milestones: Debunking Ember’s 2025 Global Electricity Review – Iowa Climate Science Education


again for all your bluster misinformation and lying the two hard cold undeniable facts remain

View attachment 460864


View attachment 460865


So shut your pie hole
What a lame attempt to attack the messenger.
All you can say is he is an activist.
Big deal.

Didn't you run away and hide after you posted a chart that claimed temperature would go down with more CO2 in the air?
It really showed how clueless you are.

Now you're showing you don't understand what net zero means.

All you post here is ancient oil$gas funded propaganda.


JohnLarue

Well-known member
Jan 19, 2005
18,821
4,261
113
What a lame attempt to attack the messenger.
All you can say is he is an activist.
Big deal.
she is an activist you moron
an activist who spouts omissions, distortions, and wishful thinking as well as misinformation
you know... your routine

Didn't you run away and hide after you posted a chart that claimed temperature would go down with more CO2 in the air?
It really showed how clueless you are.
i do not recall posting any chart / claim indicating CO2 would reduce global temperatures
the simple fact of the matter is CO2 is not the control knob for the planets temperature
Our climate is far far more complex and dynamic than that

you are a high school drop out , so you are the clueless scientific illiterate


Now you're showing you don't understand what net zero means.
I know exactly what net zero means
it means world wide famine, poverty, and ultimately world wide communist / socialist authoritarian rule

All you post here is ancient oil$gas funded propaganda.
do not be so god damn stupid

Our World in Data is not a oil and gas funded organization
1752465688317.png


and the data for chart displaying the stupidity of the net zero concept comes from
The Energy Institute (EI) is the chartered professional membership body for people who work across the world of energy. Our purpose is to accelerate a just global energy transition to net zero.
do you work at being are stupid or does it come naturally to you ?
go sit in the corner with your dunce cap on

1752465739212.png


now this is ridiculous and illustrates how stunned you are

you continually post irrelevant ridiculous panicky tweets / posts by other climate nutters
since when is Climate Dad on X the relevant authority?

you just prove you are a parrot incapable of original thought
you set the bar for aspiring morons the world over

now shad up and go sit in the corner with your dunce cap on
 
Last edited:
  • Love
Reactions: The Oracle

Frankfooter

dangling member
Apr 10, 2015
100,754
27,844
113
she is an activist you moron
an activist who spouts omissions, distortions, and wishful thinking as well as misinformation
you know... your routine


i do not recall posting any chart / claim indicating CO2 would reduce global temperatures
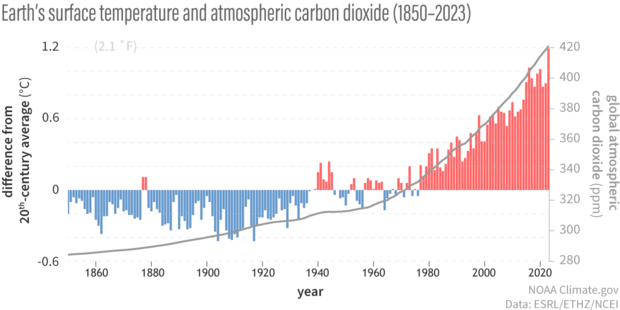
the simple fact of the matter is CO2 is not the control know for the planets temperature
Our climate is far far more complex and dynamic than that

you are a high school drop out , so you are the clueless scientific illiterate


I know exactly what net zero means
it means world wide famine, poverty, and ultimately world wide communist / socialist authoritarian rule


do not be so god damn stupid

Our World in Data is not a oil and gas funded organization
View attachment 460938


and the data for chart displaying the stupidity of the net zero concept comes from

do you work at being are stupid or does it come naturally to you ?
go sit in the corner with your dunce cap on

View attachment 460939

you set the bar for aspiring morons the world over

now shad up
You're just slandering her now without anything to back it up. Its you that posts distortions, misinformation and wishful thinking.
Lets go back to the chart you posted that you now claim you didn't.


Posted here
According to this chart the global temperature should have declined slightly as CO2 levels rose.
You cite this as proof that CO2 can't be a forcing effect on the climate.

But the real numbers show its an idiotic argument.


JohnLarue

Well-known member
Jan 19, 2005
18,821
4,261
113
You're just slandering her now without anything to back it up. Its you that posts distortions, misinformation and wishful thinking.
Lets go back to the chart you posted that you now claim you didn't.


Posted here
According to this chart the global temperature should have declined slightly as CO2 levels rose.
You cite this as proof that CO2 can't be a forcing effect on the climate.

But the real numbers show its an idiotic argument.


oh my god , you bloody moron fool

do you not understand what increment means ??

nobody else is fool enough to even remotely think
According to this chart the global temperature should have declined slightly as CO2 levels rose.
the heating effect of each incremental addition of CO2 decreases relative to the previous addition of CO2 to a point you can not measure the difference

that point occurred long before the industrial revolution

claiming this chart indicates cooling is dead wrong and you stupid interpretation puts on display your comical and complete scientific ignorance

you are worst than hopeless
go sit in the corner with your dunce cap on
1752514085957.png
 

Frankfooter

dangling member
Apr 10, 2015
100,754
27,844
113
oh my god , you bloody moron fool

do you not understand what increment means ??

nobody else is fool enough to even remotely think


the heating effect of each incremental addition of CO2 decreases relative to the previous addition of CO2 to a point you can not measure the difference

that point occurred long before the industrial revolution

claiming this chart indicates cooling is dead wrong and you stupid interpretation puts on display your comical and complete scientific ignorance

you are worst than hopeless
go sit in the corner with your dunce cap on
View attachment 461213
Ok, fine.
I misread the chart.

Were your chart accurate then you would expect that the planet would have warmed about 0.1ºC for every 20ppm increase. Since we are talking about an increase of about 170 ppm we'd expect around 1.5ºC or so warming, though its hard to tell as your chart doesn't show scale.

And this is a from a chart that appears to only include the effect of CO2, not any feedback effects like increased humidity, lower albedo, ice melts or other tipping points.

Which means you posted a chart that proves everything you declare here is wrong, even with it ignoring feedback effects.

well done
 

JohnLarue

Well-known member
Jan 19, 2005
18,821
4,261
113
Ok, fine.
I misread the chart.
no it is not fine
you accused me of dishonesty because you were too stupid to understand the subject matter
there are idiots and then there is you, an obnoxious lying idiot

Were your chart accurate then you would expect that the planet would have warmed about 0.1ºC for every 20ppm increase. Since we are talking about an increase of about 170 ppm we'd expect around 1.5ºC or so warming, though its hard to tell as your chart doesn't show scale.
no you blithering fool
the warming effect is not linear with concentration
had you stayed in school you might have learned not all scientific relationships are linear
but alas you dropped out of school

1752528572477.png

the heavy lifting was done by the first 20 ppm which occurred billions of years ago


And this is a from a chart that appears to only include the effect of CO2, not any feedback effects like increased humidity, lower albedo, ice melts or other tipping points.
there is no feedback from a diminishing effect you blithering fool

Which means you posted a chart that proves everything you declare here is wrong, even with it ignoring feedback effects.

well done
no it means your complete lack of scientific understanding continues to result in you peddling lies and misinformation

try leaning what a logarithmic relationship is
nature is full of then


Logarithmic absorption is a concept in optics and spectroscopy where the absorption of light is quantified using logarithmic functions. This is particularly useful in measuring the amount of light that is absorbed by a material, which is crucial for applications such as UV-Visible spectroscopy and high-performance liquid chromatography. The absorbance (A) of a material is defined as the logarithm of the ratio of incident to transmitted radiant power through the material, which is a dimensionless quantity. This logarithmic function allows for the representation of the relationship between the absorption of light and the concentration of the absorbing medium, making it a fundamental tool in various scientific fields.1
Learn more:
 

Attachments

Frankfooter

dangling member
Apr 10, 2015
100,754
27,844
113
the warming effect is not linear with concentration
had you stayed in school you might have learned not all scientific relationships are linear
but alas you dropped out of school
Your post shows that the planet is warming with CO2, at least you are finally admitting that CO2 emissions are warming the planet.
But your chart is obviously flawed since those numbers are based only on modelling of CO2 emissions and not in conjunction with what that warming does to other feedback effects. That is where the exponential curve of warming is happening.

Now you are just left trying to argue that while CO2 does create the climate change you've been denying here, you think that adding more won't increase it as much. Its still an idiotic argument, but you are one step closer to understanding how wrong you are.

Does this look linear to you?
Does this look the amount of warming is decreasing as CO2 increases?


JohnLarue

Well-known member
Jan 19, 2005
18,821
4,261
113
Your post shows that the planet is warming with CO2, at least you are finally admitting that CO2 emissions are warming the planet.
NO IT DOES NOT you blithering idiot
it shows there is a diminishing potential for CO2 to absorb heat after the first 20 ppm and that potential has diminished to the point the incremental additions do not matter.

warning the atmosphere, oceans and land are a complete different matter
DO YOU HAVE ANY IDEA HOW BIG THE ATMOSHERE IS ?

But your chart is obviously flawed since those numbers are based only on modelling of CO2 emissions and not in conjunction with what that warming does to other feedback effects. That is where the exponential curve of warming is happening.
oh my god you are obstinate and a blithering fool
you do not even remotely understand the scientific information yet you make these wide sweep and completely false conclusions

Now you are just left trying to argue that while CO2 does create the climate change you've been denying here, you think that adding more won't increase it as much. Its still an idiotic argument, but you are one step closer to understanding how wrong you are.
too funny
first you claim the graph displays cooling now you claim it creates climate change

it proves nothing of the sort
it only proves you to be a god damn blithering fool

diminishing returns means no perceivable impact
go sit in the corner with your dunce cap on


1752544702986.png
Does this look linear to you?
Does this look the amount of warming is decreasing as CO2 increases?

that is called spurious correlation (with fiddled data)

too bad the long term trend states there is no direct linear relationship

1752544861470.png


And the laws of physics are universal and do not change to just suit the evil political agenda of a blithering idiot named frankfooter

go sit in the corner with your dunce cap on

you wont
instead you will post a tweet from some other bed wetting moron
climate Dad # 4237
 
Last edited:

Frankfooter

dangling member
Apr 10, 2015
100,754
27,844
113
diminishing returns means no perceivable impact


View attachment 461359


that is called spurious correlation (with fiddled data)
C'mon, Mr Science, you can do better than that.
Every single measurement of surface temp and CO2 show the same results.
You know this because you had to try a bait and switch to try to use temps from the troposphere because all surface temps show you to be wrong.

Now you're slandering NASA and declaring they are 'fiddling data'.
How shitty a human do you have to be to slander all scientists.

Look at that chart and tell us that it shows 'no perceivable impact'.
You have to be a moron to deny that the planet has warmed 1.5ºC and say that is 'no perceivable impact'.


Frankfooter

dangling member
Apr 10, 2015
100,754
27,844
113
Another bullshit chart with no sources cited, just an image that has been copy and pasted over and over again.

This is from a legit paleoclimate paper. Note the correlation.


Rae et al, 2021. Note the correlation. Note I'm linking the original papers.


JohnLarue

Well-known member
Jan 19, 2005
18,821
4,261
113
C'mon, Mr Science, you can do better than that.
Every single measurement of surface temp and CO2 show the same results.

figure it out stupid
the surface temperature record is a mees and has been fiddled with


too bad for you the long term trend indicates there is no correlation

1752554633303.png
And the laws of physics are universal and do not change to just suit the evil political agenda of a blithering idiot named frankfooter

go sit in the corner with your dunce cap on
 
  • Like
Reactions: The Oracle

Frankfooter

dangling member
Apr 10, 2015
100,754
27,844
113
figure it out stupid
the surface temperature record is a mees and has been fiddled with
No, it hasn't, larue.
Its an idiotic claim that has you not only slandering scientists all across the planet but arguing they are all in a conspiracy theory theory together.
This chart compares 6 different and independent global temperature monitors.

NASA, Hadly, NOAA, Japan, Berkely and C&W.
You really going to argue that they all fiddled with their data exactly the same way for some reason?

That is just idiotic.


JohnLarue

Well-known member
Jan 19, 2005
18,821
4,261
113
No, it hasn't, larue.
Its an idiotic claim that has you not only slandering scientists all across the planet but arguing they are all in a conspiracy theory theory together.
This chart compares 6 different and independent global temperature monitors.

NASA, Hadly, NOAA, Japan, Berkely and C&W.
You really going to argue that they all fiddled with their data exactly the same way for some reason?

That is just idiotic.


Michael Mann


U of G prof says climate fears based on flawed statistics
The researchers applied Mann�s method to lists of trendless random numbers with the same pattern of variability as tree ring data. �His method yielded a hockey stick-shaped pattern 99 per cent of the time,� said McKitrick. �This erroneously suggests that the data are dominated by hockey stick patterns, when, in fact, the data we fed in are simply machine-generated noise with no underlying trend.�

When McKitrick and McIntyre corrected the analysis and recalculated average temperatures using the same tree ring data used by Mann, they found that the 20th century still experienced an increase in average temperature, but the change is well within the bounds of natural variability.


In a BBC Q&A and corresponding interview released Friday, the discredited Climategate conspirator revealed a number of surprising insights into his true climate beliefs, the most shocking of which was that 20th-century global warming may not have been unprecedented.
Imagine a man who has spent the better part of the past 25 years toiling to convince the world of CO2-forced 20th-century warming now admitting that the difference in warming rates for the periods 1860-1880, 1910-40 and 1975-2009 is statistically insignificant. Jones even acceded that there has been no statistically-significant global warming since 1995;
So yeah data that has been fiddled with
 
Last edited:

Frankfooter

dangling member
Apr 10, 2015
100,754
27,844
113
Michael Mann


U of G prof says climate fears based on flawed statistics


So yeah data that has been fiddled with
You brought up two people who were found guilty of defaming Mann by the courts as proof their is manipulation of surface temperatures by 6 different organizations?
larure, this is a new level of idiocy.

All you offer is character assassination of a well respected scientists at the hands of two oil funded lobbyists.

The hockey stick chart has been vindicated so many times while Mcintyre is a laughing stock.

This is where we are now, larue.
And if you want to complain about the handle of 'climate dad' you'll need to explain why you chose 'mr science' as yours.

 
Ashley Madison
Toronto Escorts