Your chart ignores the fact that during those time periods the planet went through a series of thermal maximums and ice ages.typical response from somebody who refuses to look at anything he does not like
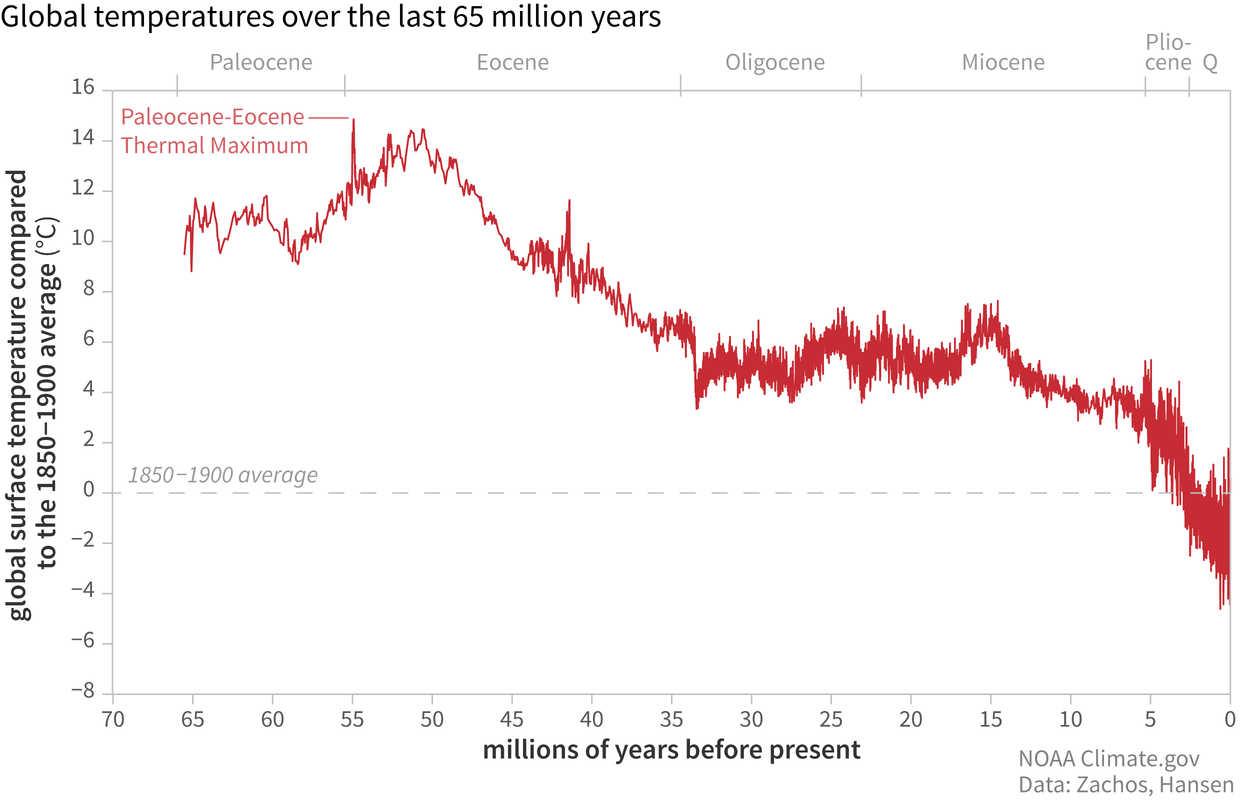
The scale is wrong and the numbers are wrong, with the highest total CO2 at around 2000 ppm.
You don't notice things like that because you're looking for disinformation.
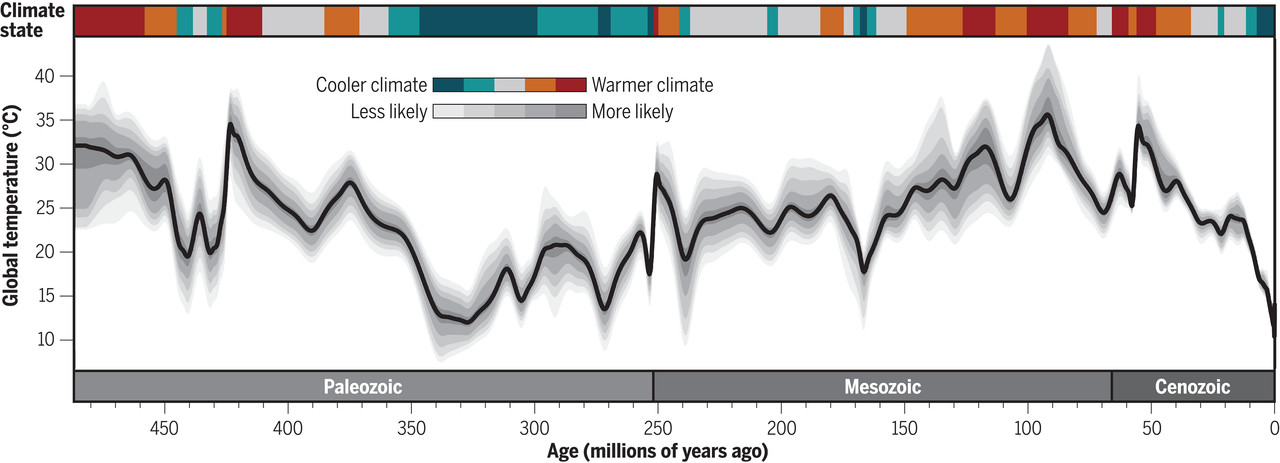
Like you would look at these two charts and not notice that one has a linear timescale and one an exponential.